History-Elections
Premiers & Politicans
From 1871 - 2020
Politics and Parties

Elections and Leaders
Development of Party Politics
Premiers & Politicans
Politics and Parties
Development of Party Politics

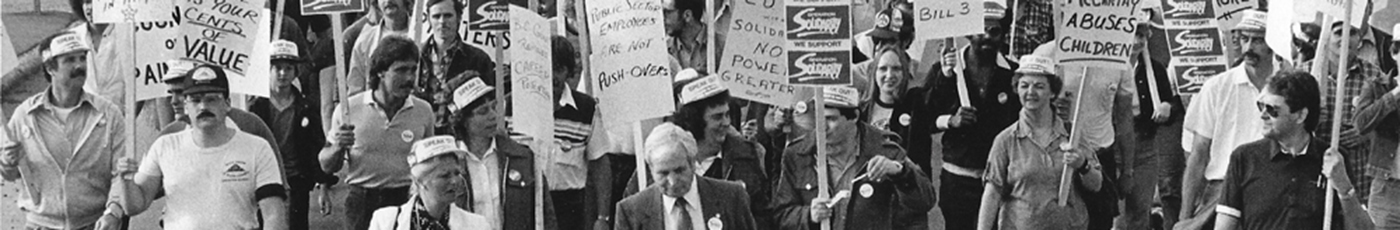
The British Columbia provincial election in 1975 was held on December 11, 1975. The election was called by the incumbent New Democratic Party (NDP) Premier, Dave Barrett, who had formed a government after the 1972 election. The election saw a relatively high level of voter turnout, with approximately 75% of eligible voters casting a ballot.
The main issues in the 1975 election included healthcare, education, the economy, and the environment. The NDP campaigned on their record of progressive social and economic policies, emphasizing their efforts to create jobs, promote social justice, and protect the environment. The Social Credit Party and the Liberal Party both campaigned on promises to reduce taxes and promote economic growth.
In the end, the election resulted in a majority government for the Social Credit Party, which won 33 seats in the 55-seat Legislative Assembly. The NDP won 18 seats, while the Liberal Party won 4 seats. Bill Bennett became Premier of British Columbia, succeeding Dave Barrett, who had been in office for only three years.
The election marked a significant defeat for the NDP government, which had been in power since 1972. The party's focus on progressive social and economic policies failed to resonate with voters, and the party suffered a significant defeat at the hands of the Social Credit Party.
Overall, the 1975 British Columbia provincial election saw a continuation of the Social Credit Party's focus on fiscal conservatism and economic growth, with social issues also playing a significant role in the election. The election also marked the emergence of Bill Bennett as a significant political force in British Columbia, a trend that would continue in subsequent elections.
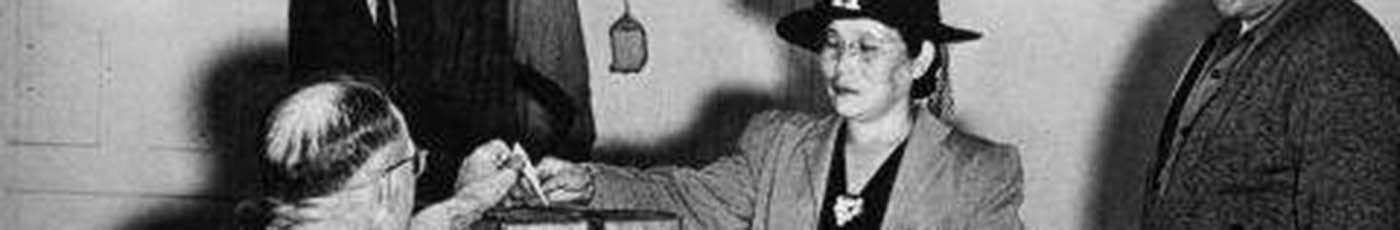
| Party | Party leader | Elected |
| Social Credit | W.A.C. Bennett | 38 |
| New Democrats | Tom Berger | 12 |
| Liberal | Patrick Lucey McGeer | 5 |
| Progressive Conservative | John DeWolf | - |
| Independent | - | |
| Communist | - | |
| Social Conservative | - | |
| Total | 55 |
| Conservative | Liberal | NDP | Social Credit | Green | Others | |||||||||
| Year | Seats | Winner | % | Seats | % | Seats | % | Seats | % | Seats | % | Seats | % | Seats |
| 1975 | 55 | SC | 4% | 1 | 7% | 1 | 39% | 18 | 49% | 35 | 0% | 0 | 0% | 0 |
This article will be posted shortly. British Columbiahistory.com is a visitor supported web site. Thank you for your feedback - it is appreciated.
Reference: Article by Greg Scott (Staff Historian), 2023
Tel: 1 604 833-9488
Email: info@canadahistorysociety.ca

All content and images are protected by copyright to Access History